Data
Account data, from Google Ads.
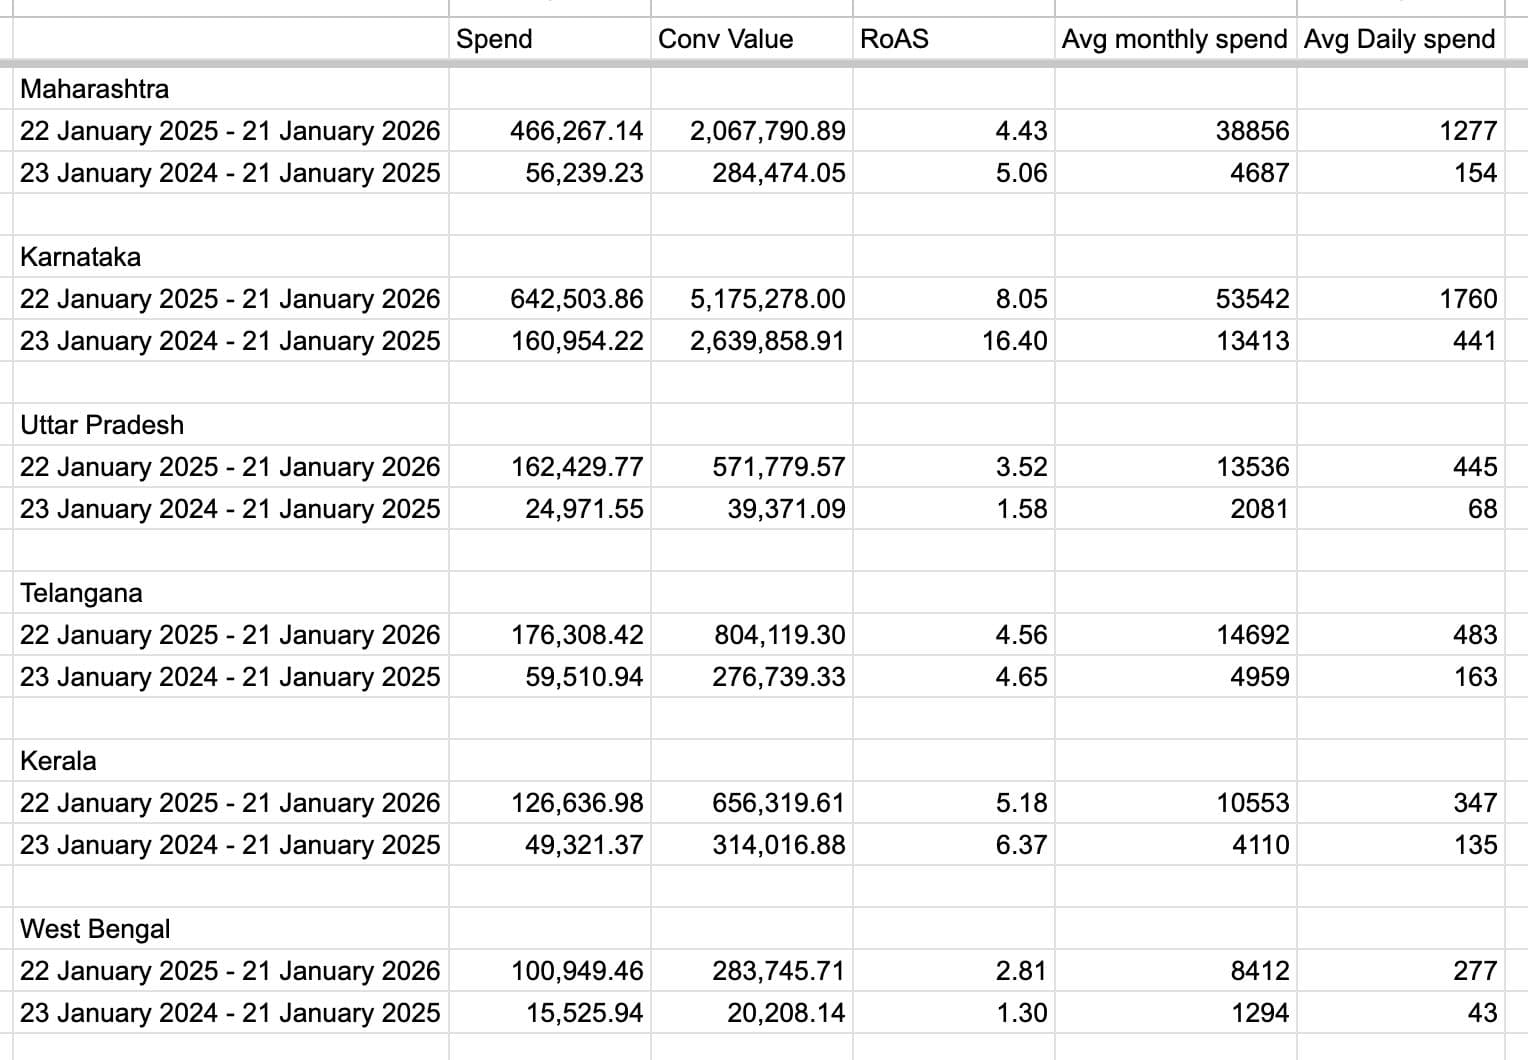
Year-on-year comparisons showing account-level performance and state breakdown for non-TN markets.
Skincare · Google Ads · Geographic Expansion
Period
Jan 2024 – Jan 2026
Channel
Google Ads
Company
Conversion Lab
Results
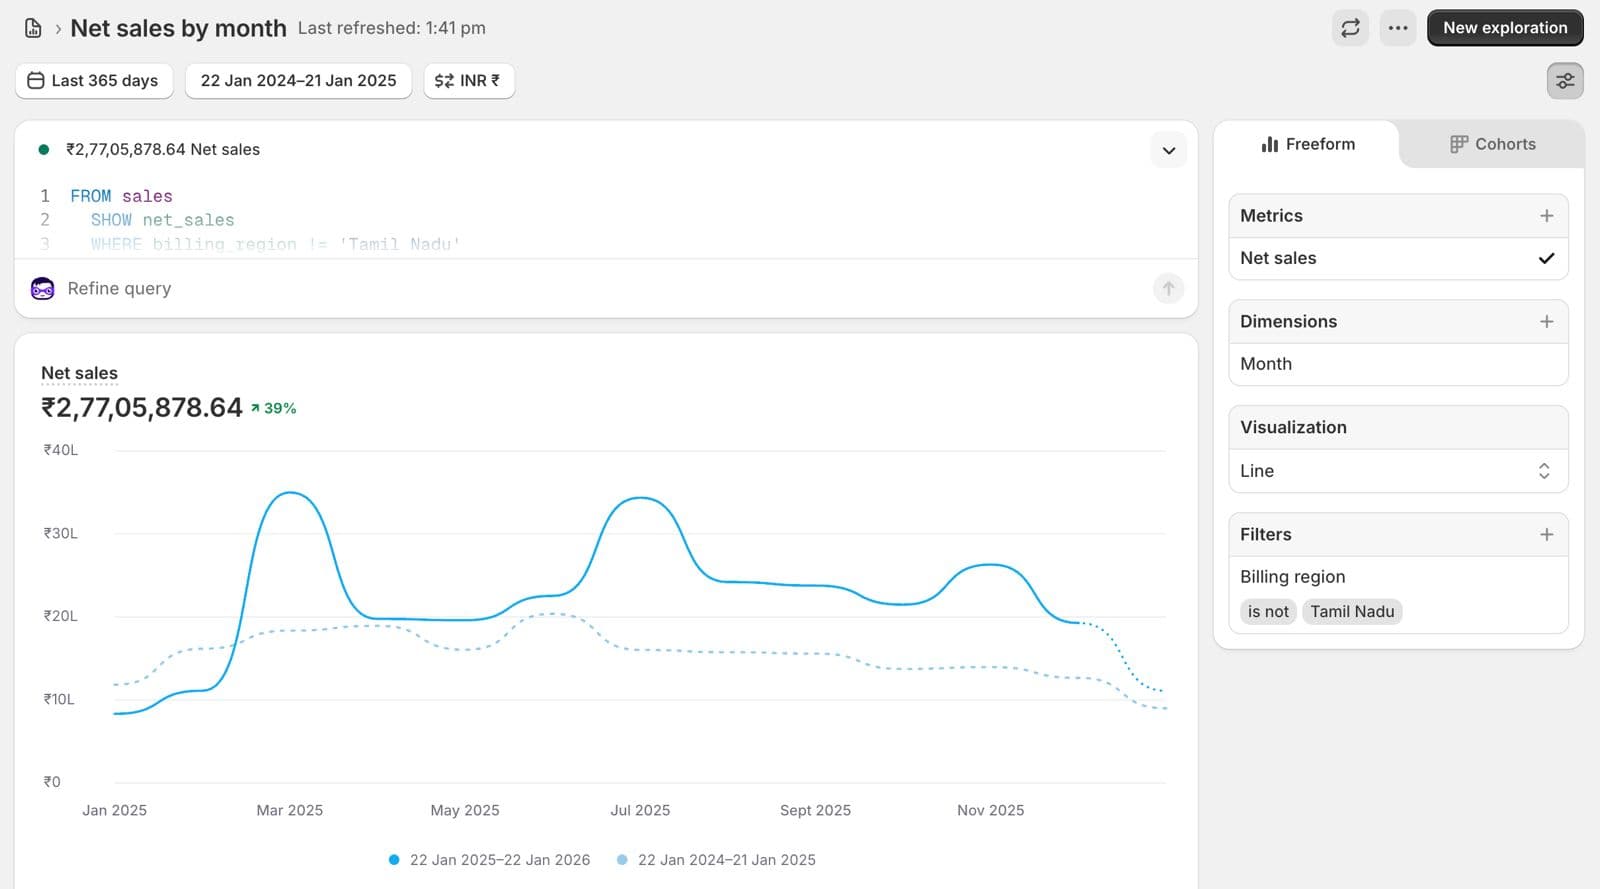
+39%
Non-TN revenue growth, year-on-year
₹2.77Cr
Non-TN Google Ads revenue in year 2
8.05x
ROAS achieved in Karnataka
Context
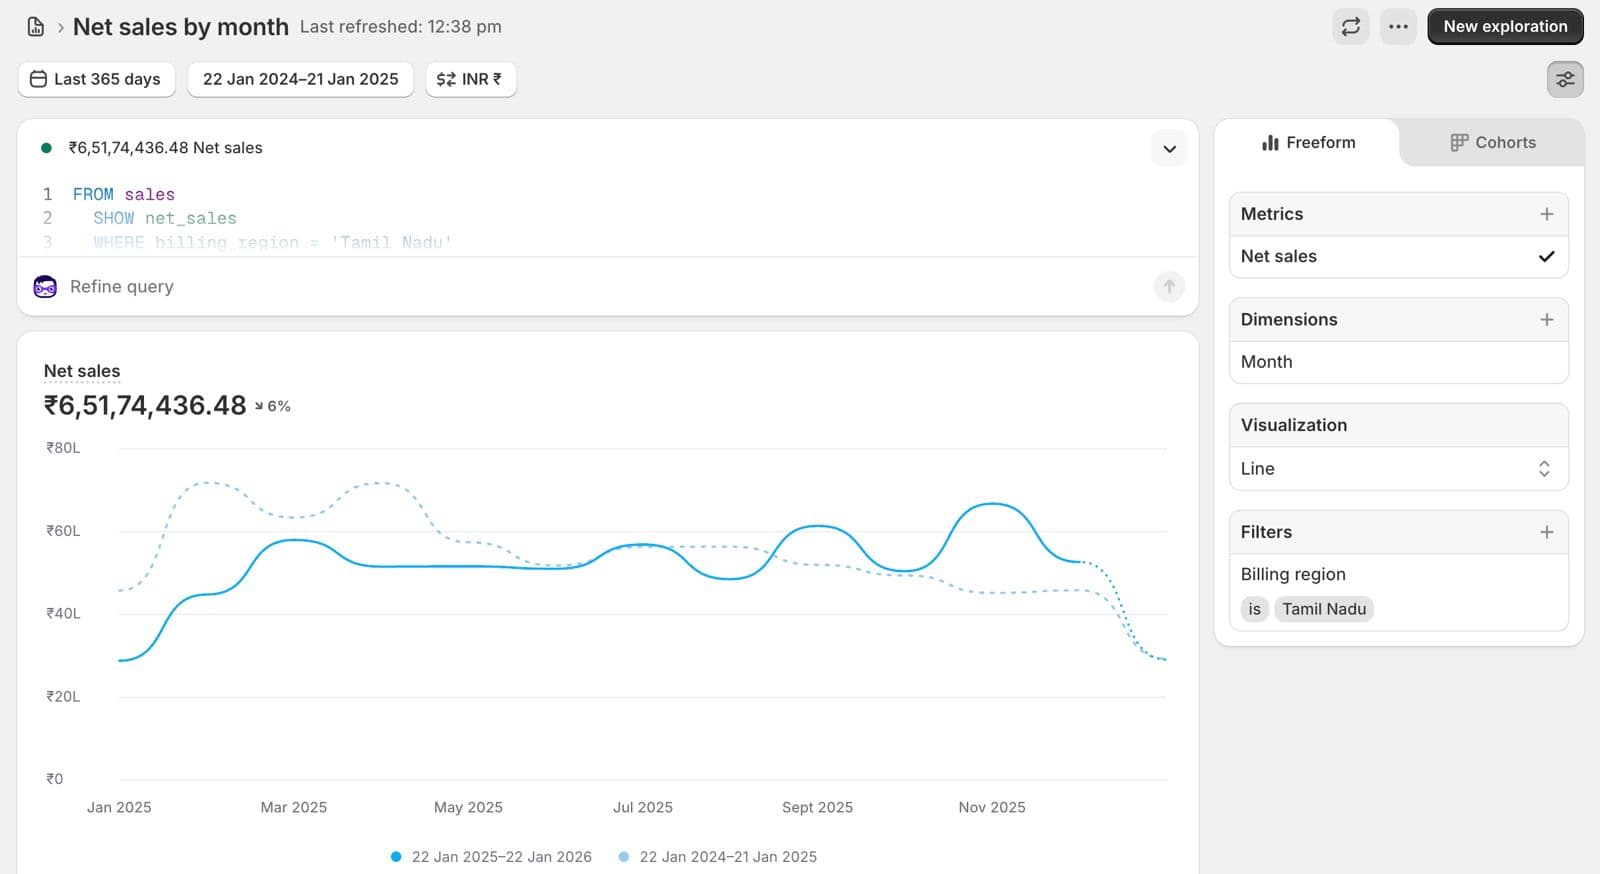
This is a skincare brand based in Tamil Nadu. In TN, it had an established customer base and reasonable brand recognition. Outside TN, it had a Google Ads account with national reach — but the numbers outside the home state weren't moving.
Non-Tamil Nadu markets were getting ad spend but returning inconsistent ROAS. Some states were clearly underperforming. Others had potential that wasn't being captured. The account structure didn't allow you to tell the difference — everything was running together with no way to isolate what was working where.
The objective was clear: grow national revenue without burning budget on markets that weren't ready. That required understanding which states had real demand, and building a structure that could find and scale them.
Approach
Audit
The brand had strong Tamil Nadu performance — it was a known name there. Outside TN, ad spend existed but wasn't working. ROAS was erratic across states, campaigns weren't structured by geography, and there was no way to tell which markets were scalable versus wasteful.
Strategy
Rather than running national campaigns and hoping for the best, I rebuilt the account with state-level segmentation. Each high-potential state got its own campaign structure, budget, and bid strategy — so performance could be read and optimised independently.
Execution
With state-level visibility, patterns emerged quickly. Karnataka responded exceptionally well — 8.05x ROAS in 2025. Bihar and UP, which had previously shown poor returns, began improving as budgets were redirected toward the ad types and audiences that were converting in those markets.
Scale
Over the full year-on-year comparison (Jan 2024–Jan 2025 vs Jan 2025–Jan 2026), non-TN revenue grew 39%, reaching ₹2.77 crore. The brand went from being regionally dependent to having a genuinely diversified national revenue base through Google Ads.
State-level results
Once campaigns were restructured by geography, the performance gaps became legible — and actionable.
Karnataka
Highest ROAS of any state
8.05x
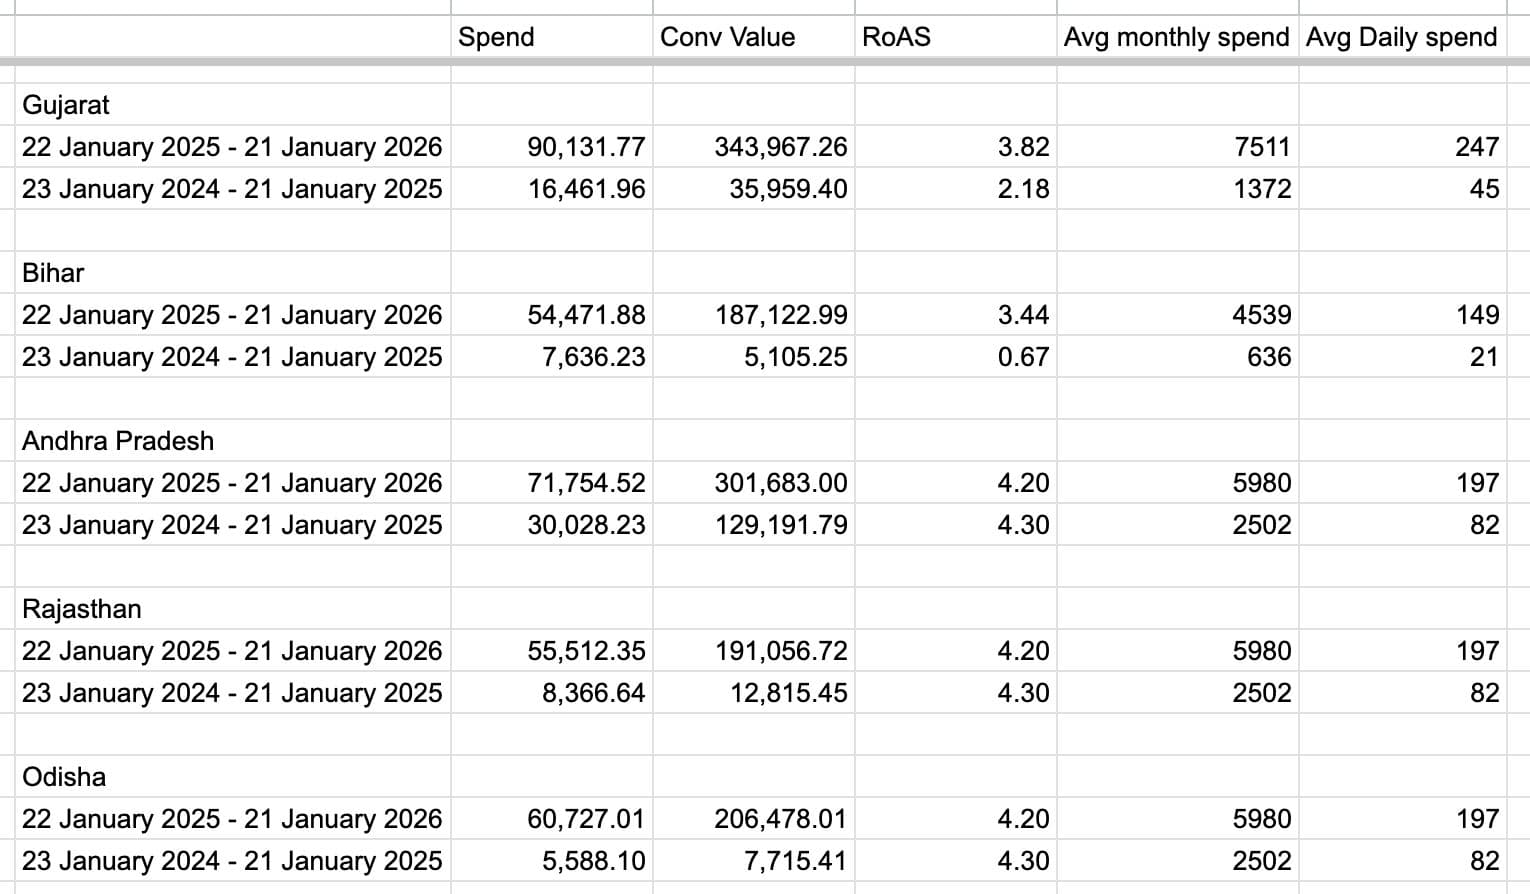
Bihar
5x efficiency improvement
0.67x → 3.44x
Uttar Pradesh
More than doubled ROAS
1.58x → 3.52x
Bihar and UP data reflects year-on-year ROAS comparison (Jan 2024–Jan 2025 vs Jan 2025–Jan 2026). Karnataka figure is for the Jan 2025–Jan 2026 period.
Data
Year-on-year comparisons showing account-level performance and state breakdown for non-TN markets.
What this shows
National campaigns don't build national presence on their own — they just spread budget thin. When you can see state-level performance independently, you find that a few markets are carrying the results and many are dragging them down.
The 39% non-TN growth wasn't from increasing total spend. It was from understanding where the demand already existed, building a structure that could capture it, and reallocating away from states that weren't converting. Geographic segmentation is an operational decision as much as a campaign decision.